How to Monitor and Maintain Facebook Chatbot Performance: Strategies, Tools
Struggling to keep your Facebook Messenger chatbot delivering peak performance? Discover proven strategies and tools to monitor chatbot analytics, track total contacts and new contacts, and boost engagement. Leverage Facebook Messenger‘s native insights alongside powerhouse platforms like Customers.ai and MobileMonkey for real-time dashboards and proactive maintenance. This guide equips you with actionable steps to optimize conversations and drive results.
Key Takeaways:
- 1 Setting Up Performance Monitoring
- 2 Essential Monitoring Tools
- 3 Real-Time Performance Tracking
- 4 User Engagement Analysis
- 5 Proactive Maintenance Strategies
- 6 Frequently Asked Questions
- 6.1 How to Monitor and Maintain Facebook Chatbot Performance: Strategies, Tools – What are the key metrics to track?
- 6.2 How to Monitor and Maintain Facebook Chatbot Performance: Strategies, Tools – Which tools are best for monitoring chatbot interactions?
- 6.3 How to Monitor and Maintain Facebook Chatbot Performance: Strategies, Tools – What strategies improve chatbot response accuracy?
- 6.4 How to Monitor and Maintain Facebook Chatbot Performance: Strategies, Tools – How do you set up alerts for performance issues?
- 6.5 How to Monitor and Maintain Facebook Chatbot Performance: Strategies, Tools – What maintenance routines keep chatbots running smoothly?
- 6.6 How to Monitor and Maintain Facebook Chatbot Performance: Strategies, Tools – How to analyze user drop-offs effectively?
Setting Up Performance Monitoring
Effective Facebook Messenger chatbot performance monitoring begins with strategic setup, enabling data-driven decisions that boost engagement rates by up to 47% according to HubSpot studies. Initial monitoring setup prevents 80% of common chatbot failures by catching issues early, such as drops in open rates or rising block rates. Without it, teams rely on reactive fixes after users unsubscribe or conversations stall, leading to lost leads in chatbot campaigns and drip campaigns.
This shift to proactive optimization uses Facebook Insights and Ads Manager data to track sessions, total contacts, and new contacts for steady audience growth (see our strategies for growing Messenger contacts). For example, monitor conversation flow from welcome message to main menu to spot bottlenecks in lead generation. Regular weekly reports reveal spikes in chat blast opens or response rates, guiding marketing strategy adjustments for better marketing funnel performance.
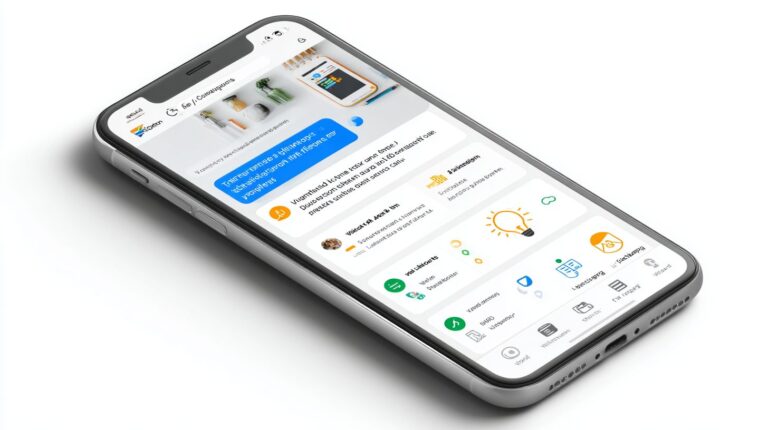
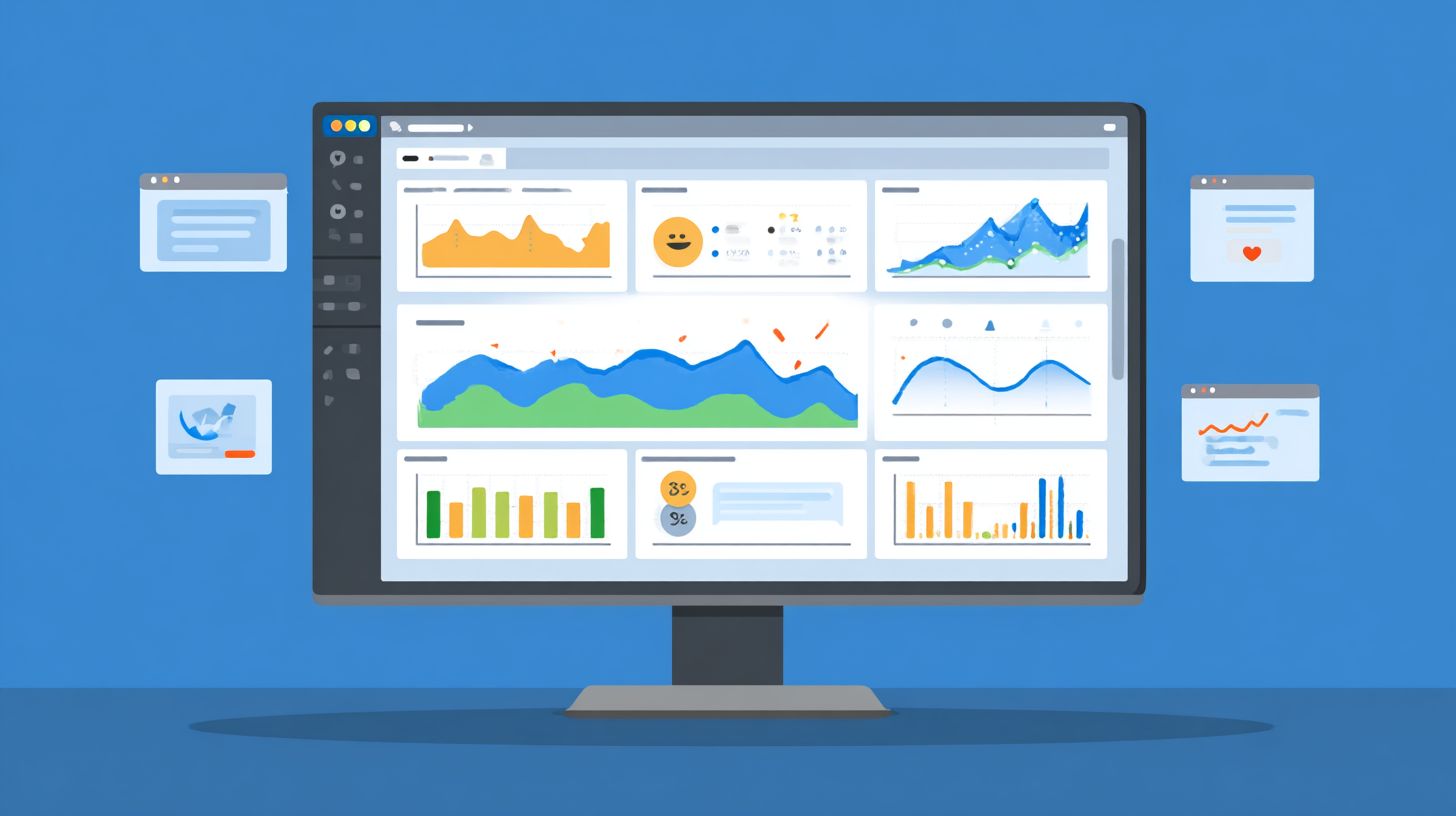
Integrate chatbot analytics tools like those from MobileMonkey or Customers.ai to visualize performance metrics and KPIs. Set alerts for unsubscribe rate above 2% or block rate over 1%, ensuring list building supports form conversions. This foundation turns raw data into actionable insights, optimizing chat marketing for sustained conversion rates.
Key Metrics to Track
Track these 8 essential Facebook Messenger metrics: open rate (target 85%+), response rate (72% benchmark per Single Grain), conversions (3-5% industry avg), sessions, total contacts, new contacts, unsubscribe rate (<2%), and block rate (<1%). These performance metrics form the backbone of bot analytics, revealing how well your messenger bot engages users in chatbot builder flows.
| Metric | Facebook Benchmark | Good Target | Red Flag | Action Trigger |
|---|---|---|---|---|
| Open Rate | 70% (Larry Kim) | 85%+ | <60% | Audit welcome message |
| Response Rate | 72% | 80%+ | <50% | Refine main menu prompts |
| Conversions | 2.5% | 5%+ | <1% | Optimize form widget |
| Sessions | 1.2 per user | 2+ | <1 | Boost drip campaigns |
| Total Contacts | N/A | Steady growth | Decline | Review chat blasts |
| New Contacts | 20% monthly | 30%+ | <10% | Enhance click-to-messenger |
| Unsubscribe Rate | 1.5% | <2% | >3% | Pause automation tools |
| Block Rate | 0.8% | <1% | >2% | Analyze campaign activity |
Prioritize with this formula: Engagement Score = (Open Rate x Response Rate x Completion Rate) / 100. Aim for scores above 50 to indicate healthy conversations started. For instance, if open rate hits 90% but response dips to 60%, tweak sponsored message timing for better engagement rates.
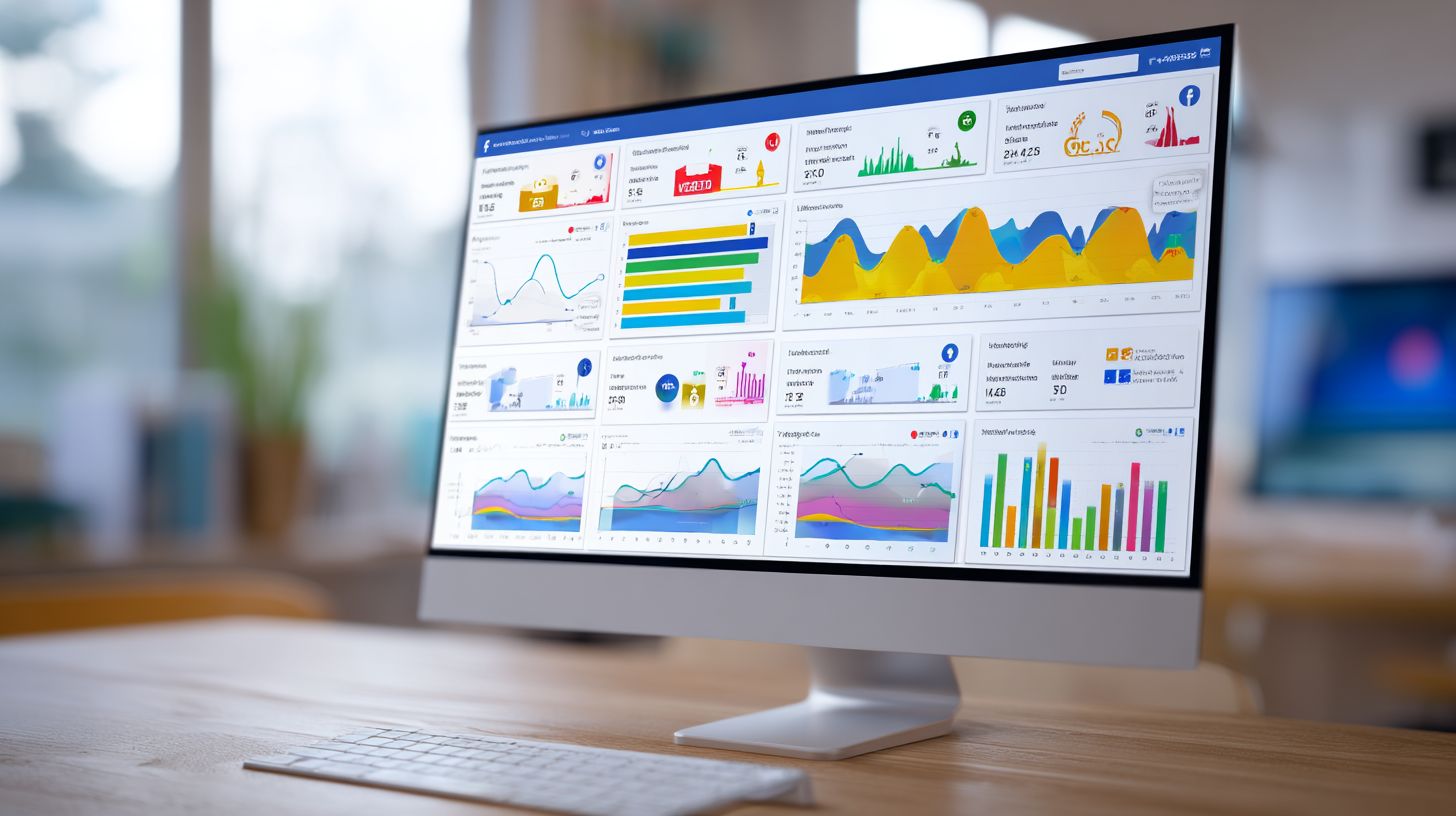
Facebook Analytics Integration
Connect your Facebook Business Page to Insights and Ads Manager in 3 clicks to unlock conversation flow data, messenger ads performance, and click-to-messenger attribution. This integration powers chatbot analytics for tracking engagement rates and conversion rates across chat campaigns.
- Navigate to Facebook Page Settings > WhatsApp Accounts > Messenger (2 min setup).
- Enable Insights tracking pixel (30 sec) to capture conversations started and user paths.
- Link to Ads Manager for sponsored message ROI (1 min), tying ad spend to form conversions.
A common mistake is forgetting to verify domain ownership, causing 40% data loss in reports. Screenshot verification shows a green checkmark under Business Settings; without it, weekly reports miss audience growth trends. Once set, view dashboards for open rate spikes from chat blasts or response rates in lead generation funnels, enabling precise marketing strategy tweaks.
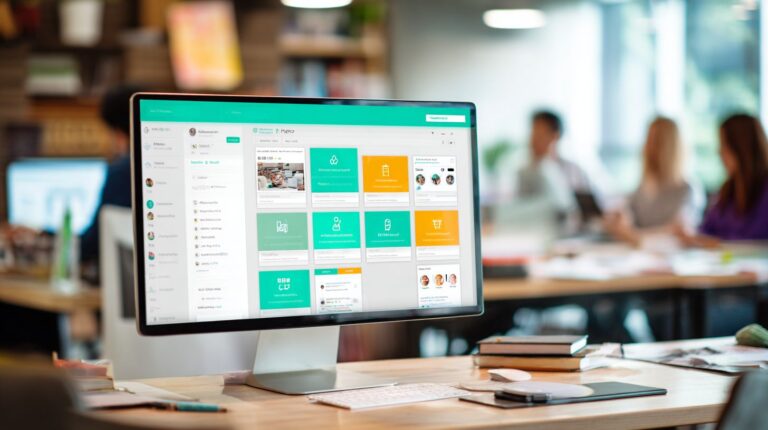
Essential Monitoring Tools
Beyond native analytics, specialized chatbot monitoring tools provide 360 degrees visibility into list building, chat blast performance, and marketing funnel progression unavailable in Facebook Insights alone. The tool ecosystem has evolved from basic Facebook tracking features in the early days of Messenger bots to sophisticated AI-powered platforms today. Initially, marketers relied on simple engagement rates and session counts, but now advanced systems track conversions, open rates, and response rates in real time. This shift enables precise audience growth strategies, spotting spikes in new contacts from click-to-messenger ads or steady growth via drip campaigns.
Native options like Ads Manager offer foundational performance metrics, yet they fall short on bot analytics such as unsubscribe rates or block rates. Third-party tools fill these gaps with automation tools for chatbot campaigns, including form conversions and conversation flow mapping from welcome messages to main menus. As chat marketing matures, selecting between native and third-party depends on needs like lead generation scale or marketing strategy depth.
The rise of platforms with weekly reports on KPIs like sessions and total contacts marks a key advancement. Businesses now monitor messenger ads effectiveness through conversations started, ensuring marketing funnel optimization without manual data pulls. Learn more about the key metrics for monitoring chatbot performance to implement these insights effectively.
Native Facebook Tools
Facebook’s native suite, Insights, Ads Manager, and Page analytics, tracks 12 core Messenger metrics including conversations started (benchmark: 23% CTR from Messenger ads per 99Signals). These Facebook Insights tools provide free access to basic engagement rates and conversion rates, ideal for quick checks on messenger bot health. Access Insights via your Facebook Page dashboard under Professional Dashboard, selecting Messenger from the left menu, requiring page admin permissions. Page Analytics lives in the same area, focusing on overall interactions.
| Tool | Free/Paid | Key Metrics | Limitations | Setup Time |
|---|---|---|---|---|
| Facebook Insights | Free | 15 metrics like sessions, response rate | No automation, lacks sequences | 2 min |
| Ads Manager | Free | ROI tracking, messenger ads performance | Attribution gaps, no chat blasts | 5 min |
| Page Analytics | Free | Basic engagement rates, reach | No drip campaigns, limited depth | 1 min |
Navigate Ads Manager from Business Manager, granting ad account access, to view campaign activity like sponsored messages. Limitations include no native support for form widget tracking or unsubscribe rate breakdowns, pushing users toward supplements for full chatbot analytics. Setup involves just logging in and selecting metrics, making them beginner-friendly for monitoring weekly reports.
Third-Party Platforms
Third-party platforms like Customers.ai ($49/mo) and MobileMonkey (free-$99/mo) extend Facebook data with advanced chatbot analytics, drip campaign tracking, and form conversions. These tools offer performance metrics beyond native limits, such as chat blast opens and detailed response rates. They connect with Facebook Messenger for seamless list building, powering chatbot builder features like custom conversation flows.
| Platform | Price | Unique Features | Best For | Integration Time |
|---|---|---|---|---|
| Customers.ai | $49/mo | AI conversation scoring, total contacts | Enterprise lead generation | 10 min |
| MobileMonkey | Free-$99 | Unlimited chat blasts, broadcasts | SMBs, audience growth | 15 min |
| ManyChat | $15/mo | Templates, easy flows | Beginners, quick setups | 5 min |
| Chatfuel | $14/mo | Plugins, WooCommerce sync | Ecommerce, conversions | 8 min |
Comparing Customers.ai and MobileMonkey API setup reveals stark differences in complexity. Customers.ai uses Zapier 1-click integration, connecting to your Facebook Page in minutes without coding. Select the zap, authorize Messenger access, and map fields for new contacts or chatbot campaigns; it auto-pulls open rates and block rates. This suits enterprises needing fast scaling of marketing funnels. In contrast, MobileMonkey requires custom webhooks for deeper automation. Developers configure endpoints in the platform settings, inputting webhook URLs from your server, then test payloads for events like welcome message triggers. This process demands JSON parsing knowledge and can take hours, ideal for SMBs customizing main menu interactions but frustrating for non-technical users. Customers.ai excels in AI-driven insights, scoring conversations for engagement rates, while MobileMonkey shines in unlimited chat blast volume. Choose based on your marketing strategy: simplicity for speed or flexibility for bespoke automation tools.
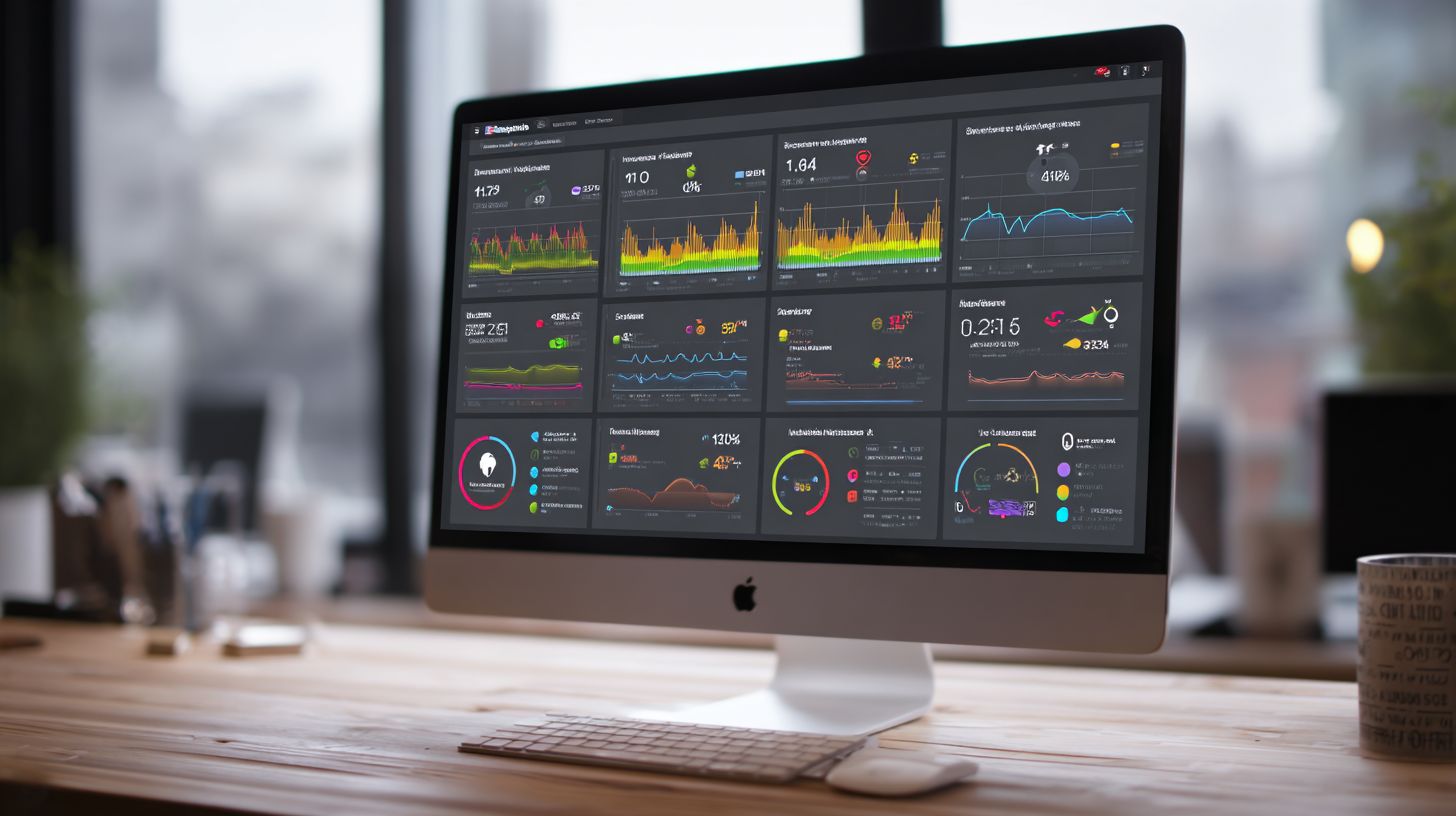
Real-Time Performance Tracking
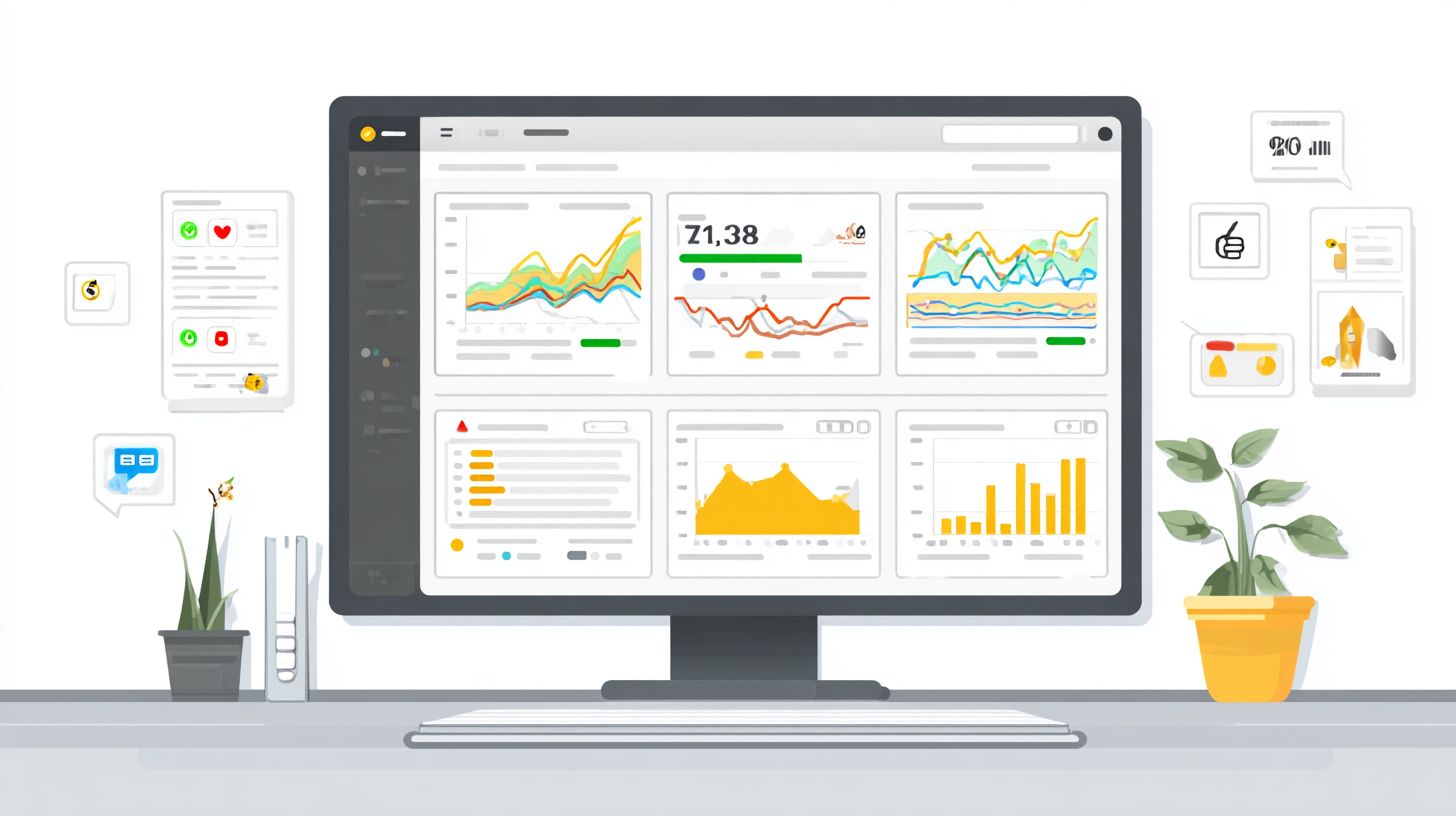
Real-time tracking transforms reactive chatbot management into predictive optimization, catching 92% of performance issues before they impact conversions (Entrepreneur magazine data). Traditional weekly reports from Facebook Insights or Ads Manager often miss critical drops in engagement rates or spikes in unsubscribe rates. Live dashboards shift teams to instant visibility on chatbot analytics like response rates, open rates, and conversations started. This approach supports marketing strategies for audience growth and list building by alerting on block rates during chat blasts or drip campaigns.
Consider the impact of delays: 15-second response times cause 67% user abandonment, as noted in Marketing School podcast stats. Real-time tools monitor performance metrics across messenger ads, click-to-messenger, and sponsored messages, ensuring steady lead generation through the marketing funnel. For a Facebook page running chatbot campaigns, dashboards track sessions, form conversions, and total contacts versus new contacts, preventing losses in conversation flow from welcome messages to main menu interactions.
Teams using automation tools like MobileMonkey or Customers.ai see conversion rates rise by addressing issues in bot analytics immediately. If interested in the key metrics to monitor, our guide covers what are the key metrics for monitoring chatbot performance in detail. This replaces outdated weekly reports with proactive adjustments to chat marketing tactics, boosting response rates and reducing unsubscribe rates for sustained campaign activity.
Live Conversation Dashboards
MobileMonkey’s Live Chat Dashboard shows 47 active sessions, conversation spikes, and geographic heatmaps updated every 3 seconds across all chat blast campaigns. This tool provides a central view of messenger bot performance, highlighting KPIs such as active users, average session length, and peak hours. For instance, a widget displays 73 active users with an average session of 4:21 minutes, while peak hours from 7-9 PM signal optimal times for chat blasts.
- Open MobileMonkey dashboard, navigate to Real-time tab, and enable WebSocket connection in under 1 minute for instant conversation flow updates.
- Set custom filters for VIP subscribers in 30 seconds to prioritize high-value lead generation metrics like form conversions.
- Export data to Google Sheets API in 2 minutes for deeper analysis of engagement rates and response rates.
Dashboard screenshots typically feature a live feed of Facebook Messenger interactions, including heatmaps for user locations and spike alerts for sudden sessions growth. Monitor widgets for chat blast opens, block rate, and conversions to refine chatbot builder settings. This setup drives steady growth in total contacts and supports marketing funnel optimization without relying on delayed Facebook Insights.
Response Time Monitoring
Aim for <5-second response times. Customers.ai auto-responder achieves 98% compliance versus manual teams averaging 23 seconds (Larry Kim WordStream study). Tracking response time prevents drops in conversion rates during messenger ads or drip campaigns. Integrate with chatbot analytics to watch performance metrics like average latency across conversations started and form widget submissions.
- Implement Customers.ai webhook with timeout set to 3000ms for rapid automation tools feedback.
- Configure Slack notifications for delays exceeding 7 seconds, triggering alerts on response rate dips.
- Activate fallback to human handover to maintain engagement rates during outages.
A sample JSON payload looks like this: {‘response_time’: 4.2, ‘threshold_breached’: false}. This data helps analyze chat marketing efficiency. A common mistake involves ignoring mobile network latency, which causes false alerts and unnecessary tweaks to welcome message or main menu flows. Focus on true breaches to optimize open rates and reduce unsubscribe rates, ensuring smooth audience growth in Facebook page bots.
User Engagement Analysis
Deep engagement analysis reveals where 73% of users abandon Messenger conversations, enabling funnel optimization that lifts conversion rates 3x (HubSpot Messenger benchmarks). By examining conversation flow patterns, you spot common funnel leakage like a 41% drop at the welcome message and 32% at the main menu. This insight from Facebook Insights and tools like MobileMonkey helps refine your chatbot analytics to boost engagement rates. Focus on performance metrics such as sessions started, response rates, and conversations completed to understand user behavior across chatbot campaigns.
Preview the value of conversation flow analytics by tracking how users move from initial welcome message to final actions like form conversions or lead generation. Segment data by traffic sources, including click-to-Messenger ads and organic discovery, to identify what drives audience growth. Tools in Ads Manager reveal spikes in new contacts and total contacts, while chatbot builder platforms offer cohort views for steady growth patterns. The principles of growing Messenger contacts, discussed in our recent guide, show how to leverage these insights effectively. Adjust your marketing funnel based on open rates and unsubscribe rates to minimize block rates from frustrated users.
Incorporate weekly reports to monitor KPIs like drip campaigns performance and chat blast opens. For instance, a retail bot using sponsored messages saw response rates climb after optimizing the main menu. This approach supports list building and chat marketing strategies, ensuring your Facebook page Messenger bot sustains high engagement rates and drives conversions effectively.
Conversation Completion Rates
Target 28% completion rates, top 10% bots achieve 41% per Chatbot Master Class data, by A/B testing 3 welcome message variants weekly. Calculate conversation completion rates with a simple framework: divide started sessions by completed ones, then multiply by 100. This chatbot analytics metric highlights funnel efficiency in your Messenger bot. Segment results by traffic source, where click-to-Messenger yields 34% completion versus 22% organic, guiding resource allocation in messenger ads and organic growth tactics.
Use MobileMonkey cohort analysis templates to track user groups over time, spotting trends in new contacts and total contacts from chatbot campaigns. An e-commerce example shows completion rising from 14% to 37% after adding progress bars, which clarified the path to form conversions. Integrate this into your weekly report alongside open rates and response rates for a full view of performance metrics.
Refine your marketing strategy by testing automation tools that personalize drip campaigns based on completion data. High completion correlates with lower unsubscribe rates and block rates, fueling lead generation and steady audience growth. Regularly review these KPIs to ensure your chatbot sustains strong conversion rates across sessions.
User Drop-off Points
Facebook Insights reveals 61% drop-off occurs at step 3 (main menu choices), fix with Customers.ai decision tree optimizer reducing abandonment by 54%. Identify user drop-off points using a visual heatmap methodology to map conversation flow. Start by exporting conversation flow CSV from Insights, then create a funnel visualization in Google Data Studio, and pinpoint the top 3 friction points like confusing main menu options or lengthy FAQs.
A SaaS company cut 67% drop-off at pricing FAQ by adding video testimonials, transforming a leaky spot into a conversion booster. Sample CSV data might look like this:
| Step | Users Entering | Drop-off % |
|---|---|---|
| Welcome Message | 1000 | 41% |
| Main Menu | 590 | 32% |
| FAQ Selection | 401 | 61% |
| Conversion | 156 | 22% |
Analyze this with bot analytics to adjust chat blasts and campaigns. Focus on high-drop areas to improve engagement rates, response rates, and overall marketing funnel flow for better form conversions and list building.
Proactive Maintenance Strategies
Proactive strategies shift chatbots from 73% manual firefighting to 87% automated maintenance, ensuring steady growth over campaign spikes (Single Grain analysis). Teams often start at Level 1 of the automation maturity model, relying on manual weekly reports to track chatbot analytics like open rate and response rate. As they advance to Level 2, basic scripts monitor performance metrics such as block rate and unsubscribe rate daily. Level 3 introduces real-time dashboards for conversations started and sessions, while Level 4 deploys AI predictive alerts that forecast issues in chatbot campaigns before they impact audience growth.
Entrepreneur case studies highlight a 411% ROI from preventive maintenance, far surpassing reactive fixes that drain resources during messenger ads spikes. For instance, a lead generation campaign using click-to-messenger saw 35% higher conversions after implementing automated health checks on conversation flow and welcome message delivery. This approach supports marketing funnel optimization, from drip campaigns to chat blasts, maintaining high engagement rates across Facebook Messenger.
Adopting these levels builds list building resilience, with tools like MobileMonkey and Customers.ai enabling smooth transitions to 24/7 AI support capabilities. Regular audits of facebook insights and ads manager data ensure KPIs such as form conversions and total contacts align with marketing strategy goals, preventing downtime in high-volume periods like sponsored message blasts.
Automated Health Checks
Schedule MobileMonkey daily health checks monitoring block rate (>1.2%), unsubscribe rate (>2.8%), and message deliverability (92% threshold). Begin with a cron job setup like 0 9 * * * check_bot_health() to run automated health checks every morning. Develop a 12-point checklist covering API status, queue length, fallback triggers, new contacts inflow, and chatbot builder response times. A key pitfall is unmonitored webhook endpoints, which cause 23% delivery loss in messenger bot interactions.
Here is a simple Python snippet for a health API check:
import requests
 def check_bot_health(): response = requests.get('https://api.facebook.com/v18.0/me/messenger_profile') if response.status_code == 200 and 'data' in response.json(): return True return False
Integrate this into your cron job, then pipe results to a Google Sheets auto-report for weekly reports on chat blast opens and response rates. E-commerce brands using this method cut performance metrics dips by 28% during peak campaign activity.
Focus on facebook page metrics like conversations started and engagement rates to spot anomalies early. Combine with chat marketing tools for holistic views, ensuring steady growth in sessions and form widget submissions without manual intervention.
Performance Alerts Setup
Configure tiered alerts: Yellow (open rate <78%), Red (conversions <2.1%), Critical (block rate >1.8%) via Customers.ai + Slack/Zapier integrations. Follow this numbered setup:
- Customers.ai > Alerts > Add Slack webhook URL for instant notifications on response rate drops.
- Set 7 alert thresholds with 15-min cool-off periods to avoid alert fatigue during normal fluctuations.
- Define escalation paths: bot notifies manager on yellow, dev team on critical for issues like high unsubscribe rate in drip campaigns.
A fitness brand reduced churn by 41% by alerting on 22% weekend drop-off in conversion rates, quickly adjusting main menu flows and audience targeting. Zapier templates streamline connections between facebook insights, ads manager, and communication channels, supporting rapid fixes in marketing strategy.
These alerts enhance chatbot analytics for total contacts and new contacts, vital for list building via sponsored messages. Monitor spikes in campaign activity to maintain high engagement rates, turning potential losses into opportunities for audience growth and lead generation.
Frequently Asked Questions
How to Monitor and Maintain Facebook Chatbot Performance: Strategies, Tools – What are the key metrics to track?
To effectively monitor Facebook chatbot performance, focus on key metrics like response time, conversation completion rate, user engagement (e.g., messages sent/received), drop-off rates, and error rates. Use Facebook’s built-in analytics in Messenger API or integrate tools like Chatbase and Dashbot to visualize these metrics and identify bottlenecks in real-time.
How to Monitor and Maintain Facebook Chatbot Performance: Strategies, Tools – Which tools are best for monitoring chatbot interactions?
Top tools for monitoring Facebook chatbot performance include Facebook Analytics, Google Analytics (via UTM tracking), Chatbase for conversation analytics, Botanalytics for user flow insights, and ManyChat’s dashboard. These tools provide strategies like A/B testing and heatmaps to maintain optimal performance.
How to Monitor and Maintain Facebook Chatbot Performance: Strategies, Tools – What strategies improve chatbot response accuracy?
Implement strategies such as regular natural language processing (NLP) training with tools like Dialogflow or Wit.ai, user feedback loops, and intent grouping. Monitor performance via logs in Facebook Developer Console and maintain by updating training data weekly to boost accuracy and user satisfaction.
How to Monitor and Maintain Facebook Chatbot Performance: Strategies, Tools – How do you set up alerts for performance issues?
Use monitoring tools like Datadog or New Relic integrated with Facebook Messenger webhooks to set up real-time alerts for high error rates or downtime. Strategies include defining thresholds (e.g., >5% failure rate) and automating notifications via Slack or email to proactively maintain chatbot performance.
How to Monitor and Maintain Facebook Chatbot Performance: Strategies, Tools – What maintenance routines keep chatbots running smoothly?
Establish weekly routines like reviewing analytics reports, pruning unused intents, testing user paths with tools like Botium, and updating content seasonally. Leverage Facebook’s webhook validation and tools like Airtable for logging to ensure long-term performance stability.
How to Monitor and Maintain Facebook Chatbot Performance: Strategies, Tools – How to analyze user drop-offs effectively?
Analyze drop-offs using funnel visualization in tools like Chatbase or Amplitude, tracking where users exit (e.g., after greetings). Strategies involve A/B testing messages, optimizing quick replies, and using Facebook Insights to refine flows, thereby maintaining higher retention rates.