Com.bot Conversational Analytics Dashboard
The Com.bot Chat Analysis Dashboard provides businesses with a strong method to evaluate and improve chatbot performance.
By tracking key metrics like intent accuracy, flow completion rates, and user satisfaction scores This dashboard offers useful information.
With real-time data aggregation and customizable export options, Com.bot helps businesses make informed decisions and continuously improve strategies.
Find out how to use this new tool to improve your chatbot’s effectiveness and drive better results.
Key Takeaways:
- Com.bot’s Dashboard for Conversation Analysis monitors important numbers like the accuracy of responses, completion rates of interactions, response times, and user satisfaction, all updated instantly.
- The dashboard offers CSV/JSON files that can be exported and sends webhook alerts for unusual patterns, simplifying the tracking and enhancement of chatbot performance.
- Businesses can use the Com.bot dashboard to find patterns and trends in customer interactions, improve chatbot flows and responses, and make decisions based on data for their business strategy.
- 1 What is the Com.bot Chat Analysis Dashboard?
- 2 What Metrics Does Com.bot Track?
- 3 How Does Com.bot Display the Analytics?
- 4 Why is Com.bot’s Chat Data Dashboard Important?
- 5 How Can Businesses Use Com.bot’s Chat Analytics Dashboard?
- 6 Frequently Asked Questions
- 6.1 1. What is Com.bot’s Chat Analysis Dashboard?
- 6.2 2. What data does the Com.bot Conversational Analytics Dashboard monitor?
- 6.3 3. How can I use the data from Com.bot Conversational Analytics Dashboard?
- 6.4 4. Could you get the data from the Com.bot Analytics Dashboard?
- 6.5 5. How frequently is the information refreshed on the Com.bot Conversational Analytics Dashboard?
- 6.6 6. Does the Com.bot Conversational Analytics Dashboard notify users about unusual patterns?
What is the Com.bot Chat Analysis Dashboard?
The Com.bot Conversational Analytics Dashboard is a helpful tool that improves business understanding by effectively bringing together user interactions and metrics.
This strong dashboard uses AI-driven business data and gives companies detailed information, helping them understand data and make decisions easily.
By connecting to Google Cloud and Looker, companies can see performance clearly and raise customer satisfaction scores with thorough analysis. Using such tools also ensures compliance with industry standards (our Com.bot GDPR & CCPA Compliant Bot offers further insights into maintaining data privacy).
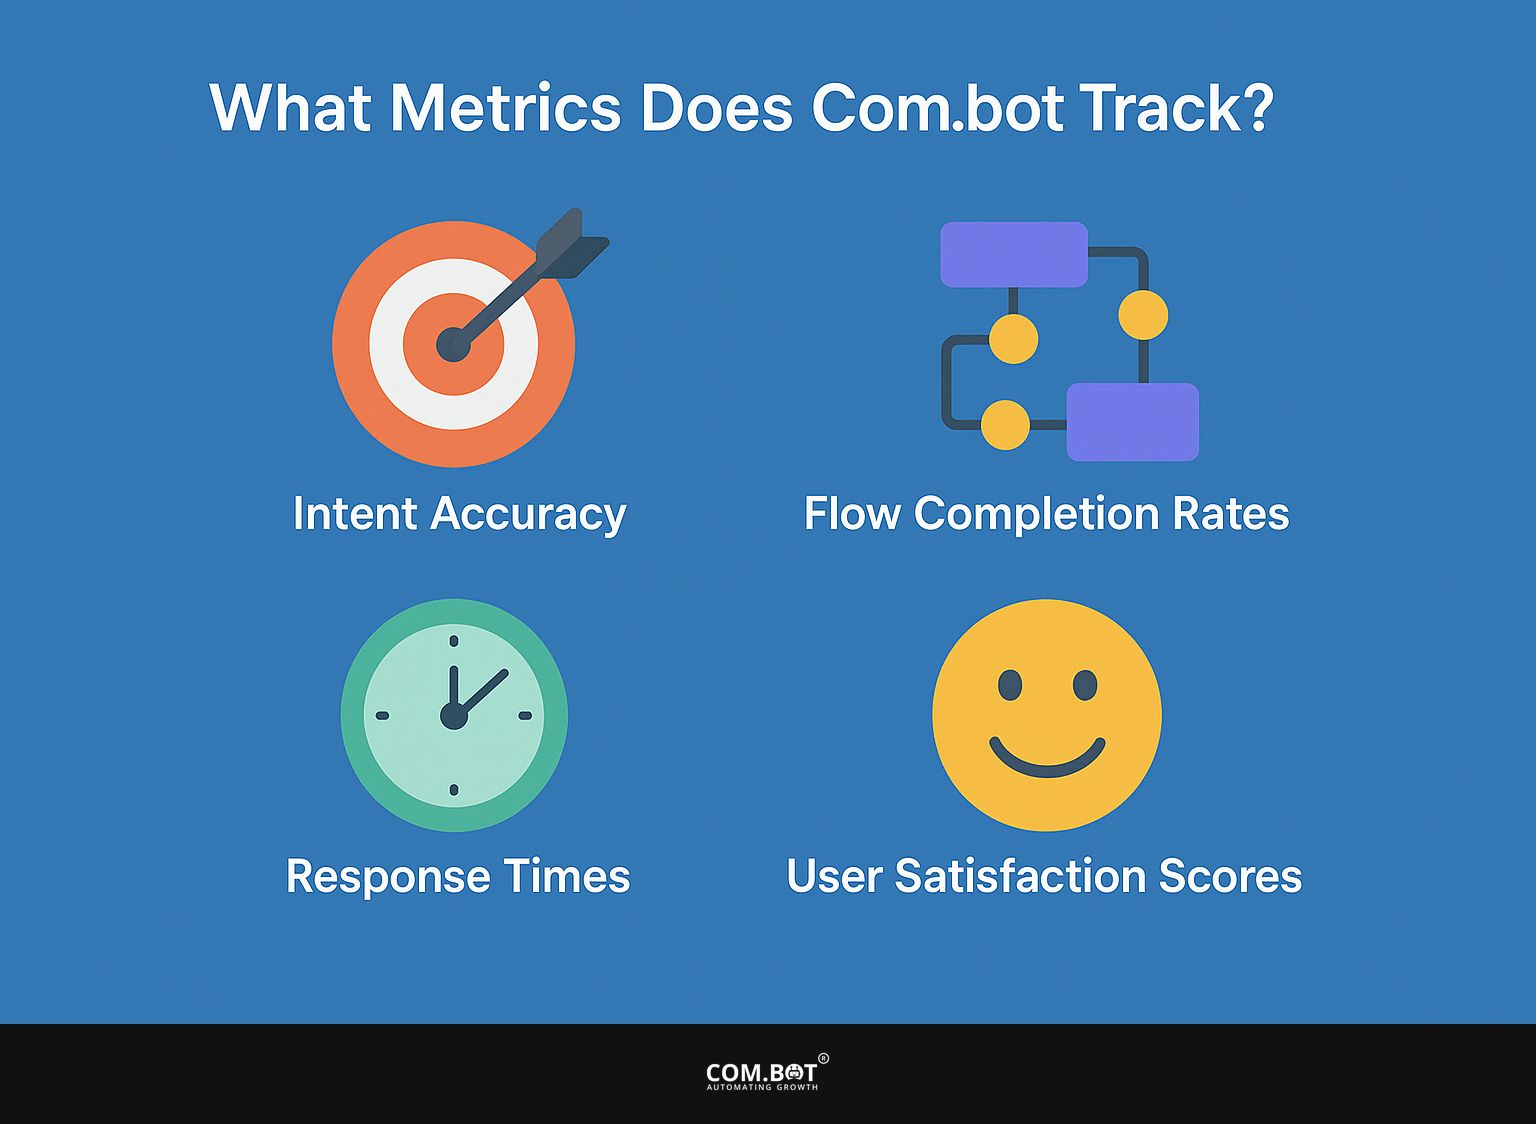
What Metrics Does Com.bot Track?
Com.bot tracks key metrics that show how users interact with the chatbot and its overall effectiveness. These metrics include:
- Intent Accuracy, which checks how well the bot understands user questions,
- Flow Completion Rates that indicate the percentage of conversations that end successfully,
- Response Times showing how quickly the bot replies,
- User Satisfaction Scores that reflect customer opinions.
These statistics help companies improve their automatic services, making sure users have a smooth experience. As mentioned, effective lead management can further enhance customer interactions, which is crucial in services like Com.bot Sales Ops Lead Routing.
1. Intent Accuracy
Intent Accuracy is a critical metric for assessing how effectively Com.bot interprets and responds to user intents in conversations. High Intent Accuracy means the bot correctly understands and responds to what users need. This is key to keeping customers happy and ensuring smooth communication.
Evaluating this measurement involves examining factors like the frequency of correct intent recognition and the occurrence of errors or misunderstandings.
When the system correctly understands what users mean, they feel listened to and appreciated, which increases their participation and happiness. If the system is not correct, users might become frustrated and choose to stop using it or search for different options.
Organizations can greatly improve user experience by using better algorithms for recognizing user intent and using ongoing data analysis. Regular updates make the system work better for users and help it handle more questions and respond to what users do more effectively.
2. Flow Completion Rates
Flow Completion Rates show the percentage of user interactions that finish the planned process within the Com.bot system. This metric is important for examining how well chatbot conversations work and spotting any possible problems that might stop users from staying engaged.
By studying these rates, developers can learn about user actions and likes, especially regarding topics created by users, which often lead to more engaging conversations.
The significance of these metrics extends beyond mere numbers; they help in fine-tuning the chatbot’s responses and suggest areas for flow improvement.
Ways to improve these completion rates include:
- Refining the flow design for clarity and relevance
- Implementing proactive monitoring tools
- Using user feedback to solve problems
These improvements increase user involvement and make the experience smooth, resulting in more satisfied users.
3. Response Times
Response Times are the amount of time Com.bot needs to reply to user questions. This step is very important for keeping users satisfied and providing them with a positive experience. Shorter response times typically lead to higher user engagement and better customer service outcomes.
These metrics are usually tracked through specialized analytics tools that monitor the time from a user’s inquiry to the eventual reply. By learning how Response Times relate to user satisfaction, organizations can create plans to improve their performance.
Some good ways to make the most of these times include:
- Using programmed replies for frequent questions
- Thorough training of customer service representatives
- Using AI technology to simplify conversations
Reducing the average time it takes to handle calls, while keeping quality, is important because it leads to better workflow and a better experience for users. Cutting down on delays can create a more interactive and engaging experience, which can lead to stronger customer loyalty.
4. User Satisfaction Scores
User Satisfaction Scores provide a quantifiable measure of how users feel about their interactions with Com.bot. High scores show that customers have good experiences, which helps build trust and loyalty.
These scores are typically gathered through post-interaction surveys, rating systems, or feedback forms, where users can express their sentiments about the service received. The collection process may involve gathering both descriptive and numerical data, helping businesses make decisions based on useful information.
Calculating these scores often involves averaging ratings or using weighted scales to better reflect user sentiment, thus helping to pinpoint areas for improvement. By looking at patterns in these scores, organizations can make their automated services work better for customers.
By using methods like active customer support, customized communication, and continuous training for AI models, satisfaction rates can be significantly increased. These scores help businesses spot customer issues and evaluate the effectiveness of automated solutions, informing adjustments and plans ahead.
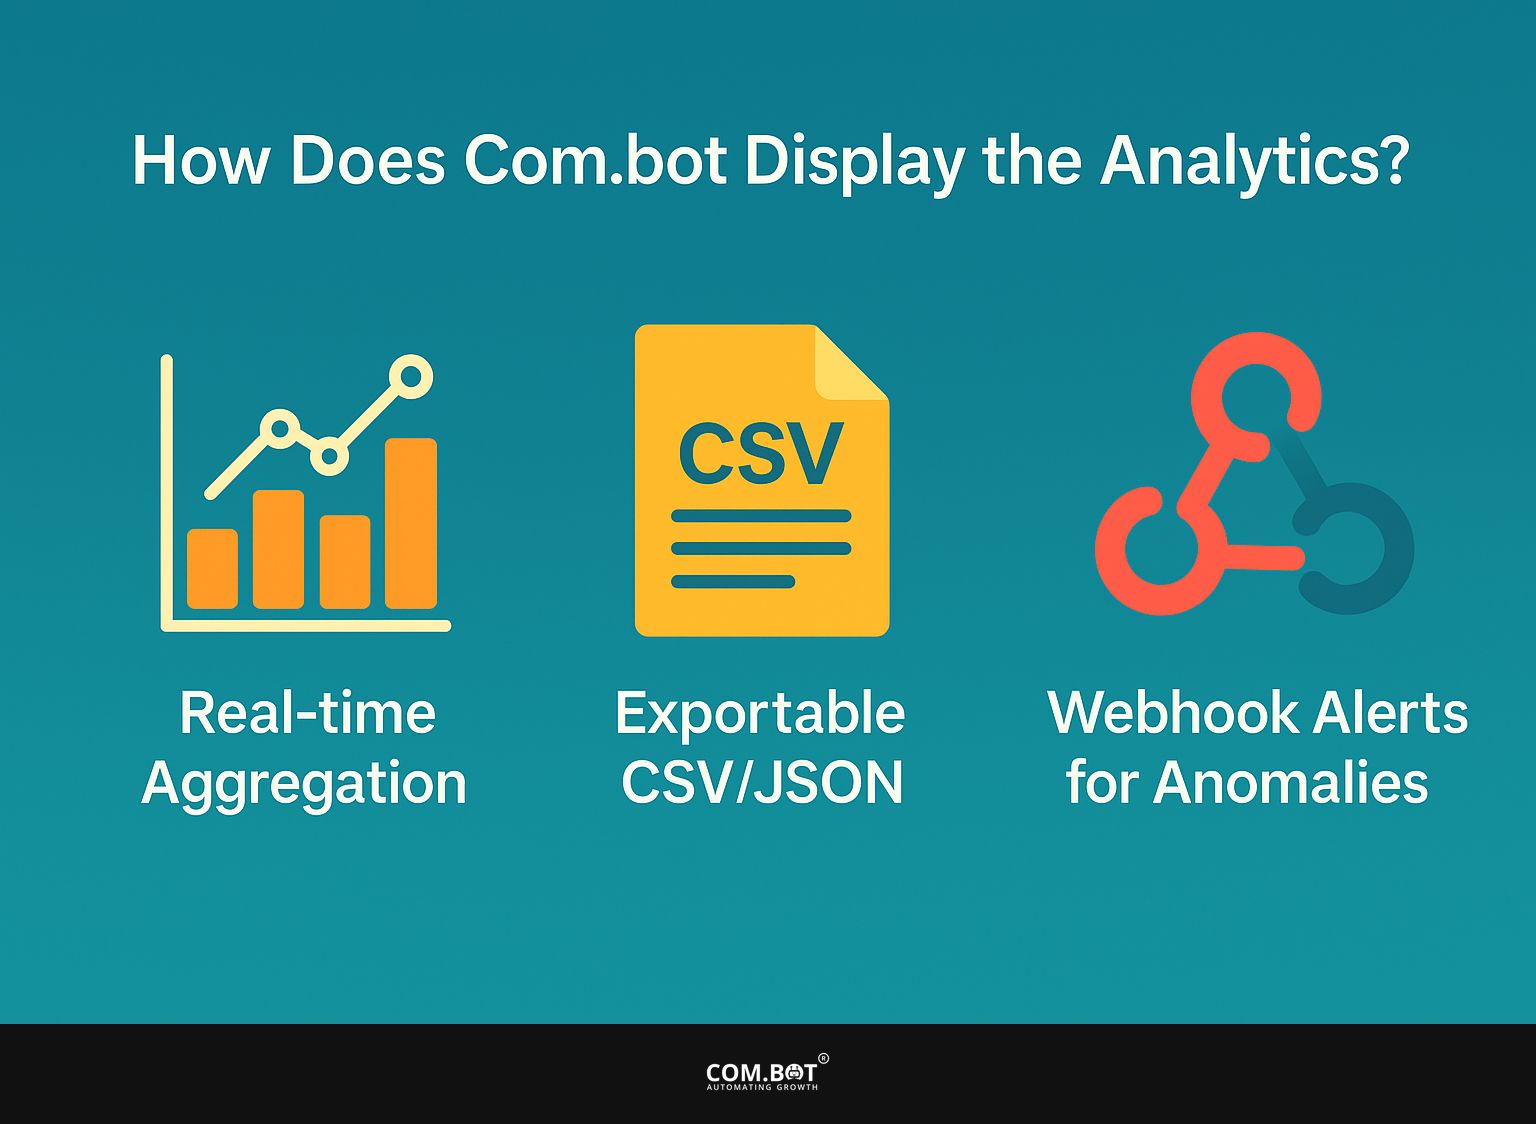
How Does Com.bot Display the Analytics?
Com.bot shows analytics in different ways that improve user experience and make data easy to access. These methods include real-time gathering of metrics, formats like CSV and JSON for simple data handling, and webhook alerts that inform users of any unusual changes in performance or metrics.
This clear display of analytics helps businesses quickly adjust and act on information from the performance dashboard. Related insight: Com.bot API Integration Bot seamlessly connects with various tools to enhance data utility and responsiveness.
1. Real-time Aggregation
Com.bot gathers and examines data as it happens, giving businesses immediate information about user actions and measurements. Using reliable data allows organizations to make informed decisions and keep up-to-date with new information.
By thoroughly analyzing this large amount of data, companies can quickly identify new trends and patterns that might otherwise be overlooked.
Getting updated data quickly is important for reacting to changes in the market and what customers want. It allows for quick changes in strategy.
Using real-time analytics assists organizations in making well-informed decisions, enhancing their operations and increasing customer satisfaction.
With the ability to track performance metrics and KPIs in the moment, businesses gain a significant competitive advantage, ensuring they remain agile in today’s fast-paced environment.
2. Exportable CSV/JSON
Com.bot offers the capability to export data in CSV and JSON formats, which facilitates the easy transfer of analytics for further analysis or reporting. This feature makes it easier to view data details and lets teams create specific reports to help with decision-making.
By utilizing these formats, businesses can easily manipulate and visualize their data, improving the efficiency of their performance dashboards.
CSV files are structured to work smoothly with spreadsheet software, allowing users to perform detailed calculations or create charts and graphs that stand out.
On the other hand, JSON format caters to more complex data structures, allowing for greater flexibility in tailoring analytics to meet specific organizational needs.
This flexibility makes workflows better and helps teams find important information for strategic plans, resulting in faster and more effective decisions.
3. Webhook Alerts for Anomalies
Webhook alerts in Com.bot serve as a proactive measure for identifying anomalies in performance metrics, ensuring that teams are alerted to any irregularities that may require immediate attention. This feature is important for handling data because it lets you act quickly.
These alerts help teams quickly address issues to keep data analysis precise and prevent ongoing errors or confusion.
By using real-time alerts, they allow quick actions to prevent possible issues with performance monitoring. When organizations use these alerts to find unusual activities, they build a system that maintains adherence to proper methods and rules.
This planning is important for keeping data clean and organized, so teams can concentrate on important findings instead of dealing with surprise data problems.
Why is Com.bot’s Chat Data Dashboard Important?
The Com.bot Dashboard is important for improving chatbots and supporting business choices. It provides detailed information on how users interact, enabling companies to upgrade their automatic services to better meet user needs.
To effectively assess these interactions, businesses can leverage techniques such as A/B testing, which allows them to experiment with different chatbot approaches and determine which ones best enhance user satisfaction and engagement.
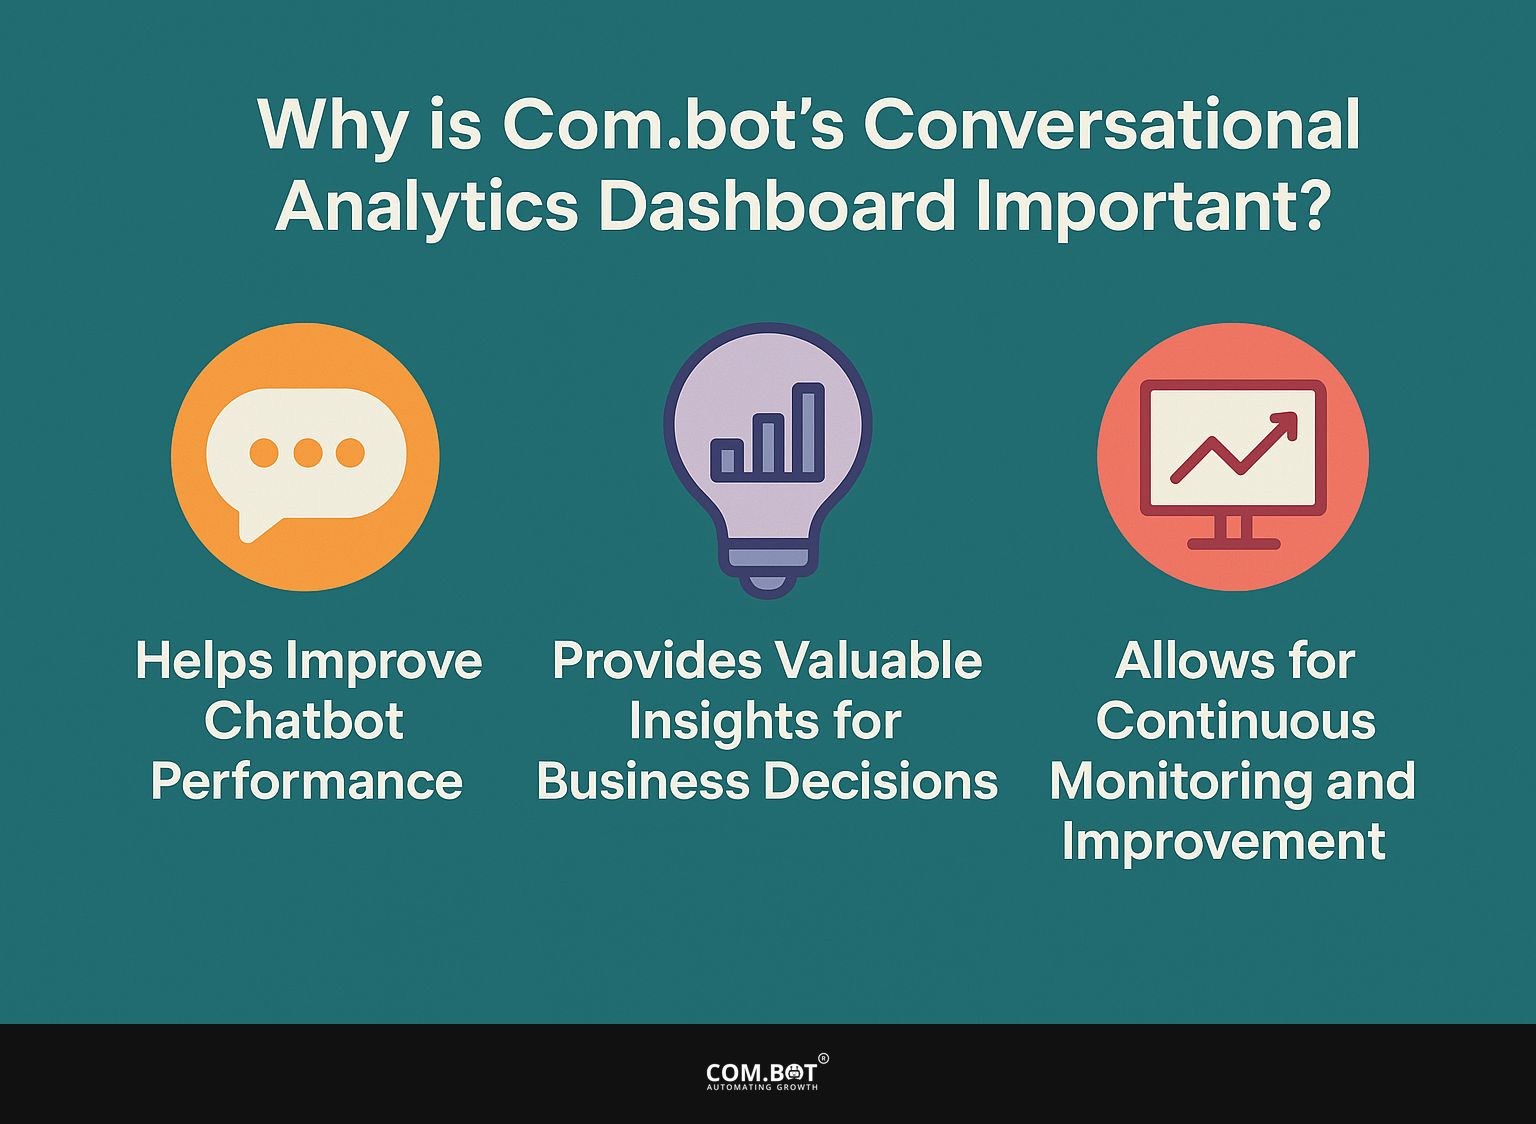
1. Helps Improve Chatbot Performance
The main goal of Com.bot’s Conversation Analytics Dashboard is to improve chatbot performance by analyzing key statistics that reflect user satisfaction and engagement. By knowing these measurements, businesses can make informed changes to their chatbot interactions and replies.
This effective tool examines data like response time, conversation completion rates, and user sentiment, enabling organizations to spot patterns over time.
For instance, if analytics show a consistent drop in completion rates during specific interactions, it may signal a need for adjustments in the dialogue design or content provided.
Looking at user feedback helps us find what customers struggle with and what they like. We can improve FAQ answers or make the chat experience better based on this information.
By making these data-driven changes, companies can improve user satisfaction and increase engagement, making sure the chatbot fulfills the audience’s needs.
2. Offers useful information for business choices
Com.bot’s analytics give helpful data for making informed business decisions. By using the performance dashboard, organizations can identify trends, monitor developments, and plan upcoming steps based on user activities.
This information gives a clear view of how consumers act, allowing companies to adjust their marketing plans and products more effectively. Real-time data allows businesses to make fast decisions, enabling them to react quickly to market changes and customer needs.
When companies use information from data, they can greatly improve how well they run their operations and achieve better business results.Predicting upcoming trends and evaluating the outcomes of various projects can improve financial performance and strengthen market position.
3. Allows for Continuous Monitoring and Improvement
Com.bot’s analytics let businesses keep an eye on performance over time and make regular updates using current data. This continuous effort is important for keeping high-quality user experience and smooth operations.
By using these analytics tools, organizations can quickly find trends and patterns that might show areas needing improvement. This proactive method allows teams to quickly respond to changes in market demands and customer preferences, helping them stay competitive and relevant.
Regular performance evaluations enable businesses to set measurable goals and benchmarks, allowing for strategic adjustments that align with their vision. Using regular analytics helps create an environment where improvements are always happening. This allows for better processes, increased productivity, and greater satisfaction for customers and employees.
How Can Businesses Use Com.bot’s Chat Analytics Dashboard?
Companies can use Com.bot’s Dashboard for Conversational Analytics to analyze customer interactions and make their chatbot systems better.
By recognizing patterns and trends in user behavior, businesses can improve their automated services and make them more effective. If interested, businesses looking to enhance their lead generation might find value in exploring how the Com.bot Chat Widget integrates conversational insights to drive potential customer engagement.
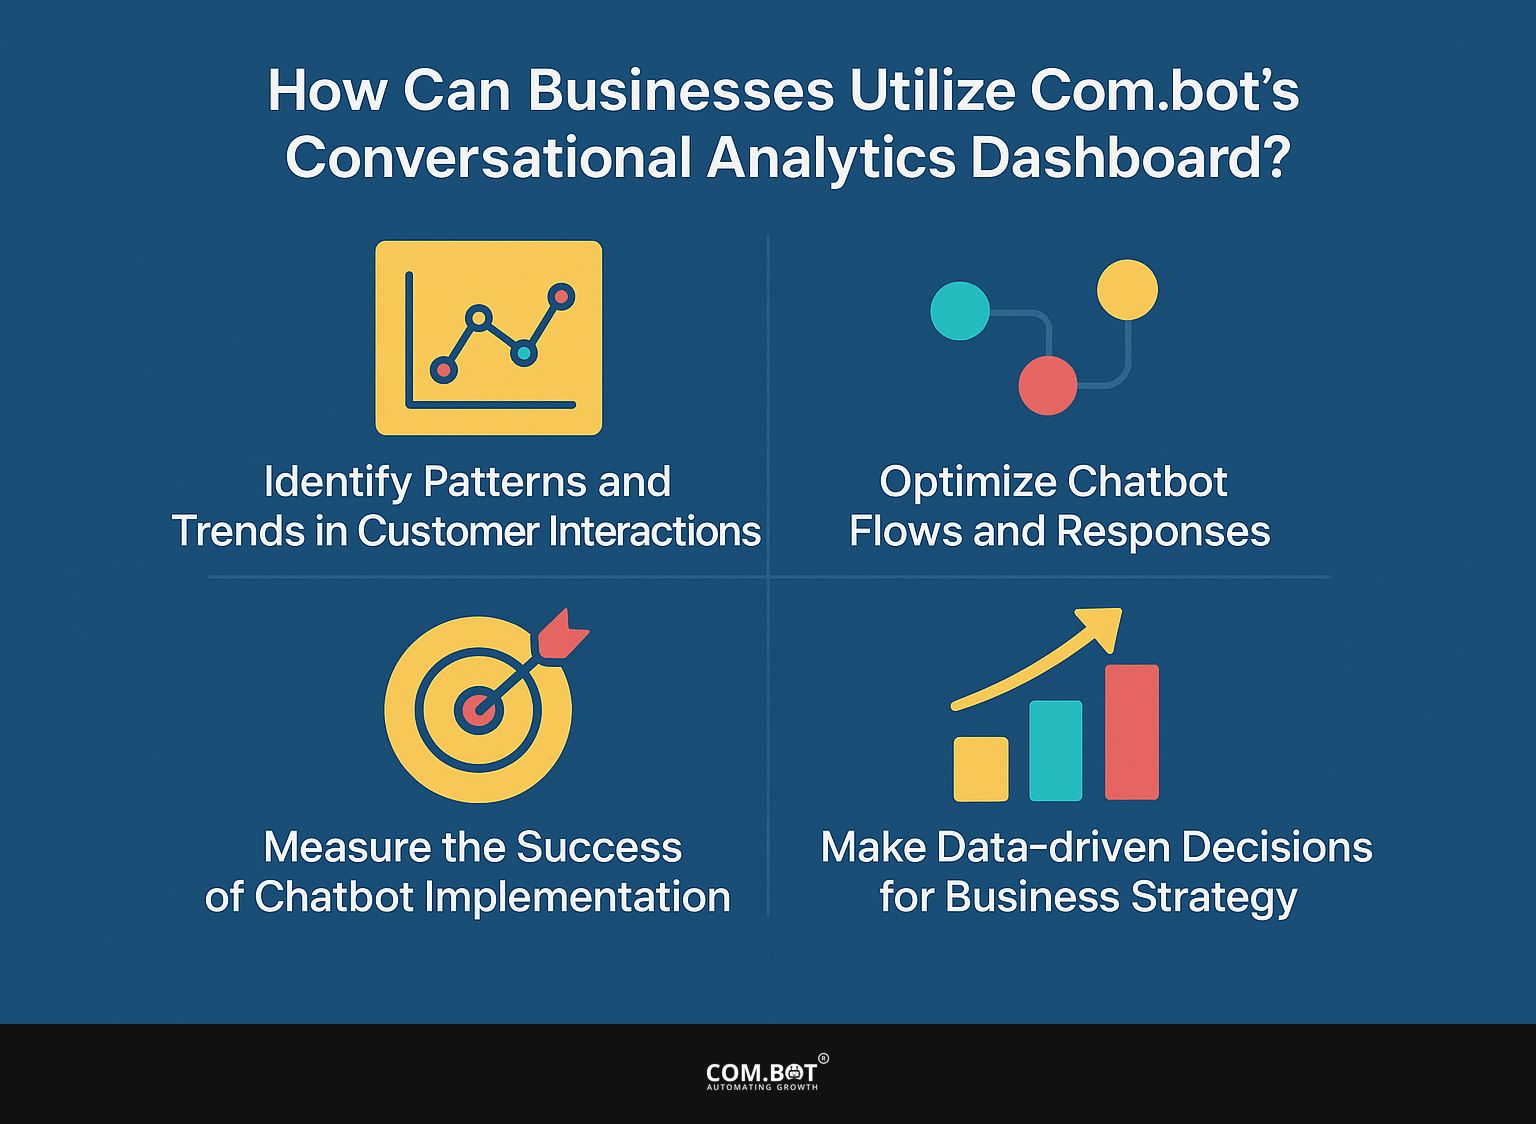
1. Identify Patterns and Trends in Customer Interactions
Finding patterns and trends in customer interactions is a basic method for businesses to use the information from Com.bot’s analytics.
By studying the questions and goals of users, companies can find shared habits and likes that help guide their service plans. This analysis can include the examination of response times, satisfaction ratings, and the frequency of specific inquiries.
Using methods like sentiment analysis and heat mapping can improve how companies grasp customer feelings and search habits, allowing them to predict needs and modify products or services.
Seeing these patterns helps create more personal interactions with customers, leading to increased involvement and commitment. By including this information in how they provide services, businesses can achieve better customer satisfaction and loyalty, leading to long-term growth.
2. Optimize Chatbot Flows and Responses
Improving chatbot communication is important for better user experiences and quick query resolution. Using analytics from Com.bot, businesses can identify where users have difficulties and adjust their bot interactions.
This process involves analyzing user interactions to identify patterns that contribute to delays or frustrations. For instance, if data indicates that users often spend excessive time waiting for responses, businesses can implement strategies to reduce these wait times.
Providing simple questions or choices helps users have better conversations. By using performance analytics, organizations can learn more about their chatbot systems. This helps them continue improving, leading to more satisfied users as they experience chat flows that function more smoothly and respond faster.
3. Measure the Success of Chatbot Implementation
Evaluating how well a chatbot works is important for determining the return on investment (ROI) and how well customer service automation performs. Through performance metrics available in Com.bot, businesses can evaluate how well their chatbots are meeting objectives and user expectations.
To measure success well, organizations can look at important numbers, like how often users are active, how quickly responses are given, and how happy customers are.
These analytics provide helpful information to improve chatbots, ensuring they perform effectively and satisfy user requirements.
For example, if more people are interacting with the chatbot, it might mean that it is answering customer questions well. If customers are unhappy, the chatbot’s conversation or features might need better development.
By regularly tracking these measurements, businesses can thoughtfully change their chatbot functions and qualities, leading to better user experience and increased return on investment.
4. Make Data-driven Decisions for Business Strategy
Using data to make business decisions is important in a competitive market, and Com.bot’s analytics provide the details required for informed planning.
By analyzing user interaction data, businesses can align their strategies with customer needs and preferences. These findings show important trends and patterns that can influence how products are created, how marketing is done, and how to interact with customers.
Using these analytics helps organizations predict changes in the market and adjust their products or services to improve customer happiness and increase profits.
As teams use these findings in their strategic planning, they develop a plan based on current data instead of guesses, supporting flexibility and strength. The combination of information from analytics and careful business planning helps decision-makers use resources wisely, track success correctly, and gain an advantage over competitors.
Frequently Asked Questions
1. What is Com.bot’s Chat Analysis Dashboard?
Com.bot Conversational Analytics Dashboard is a tool that gathers and evaluates information from user conversations with your chatbot. It offers immediate information on how accurate intents are, how often flows are completed, response times, and user satisfaction ratings. You can export this data in CSV/JSON format and get webhook alerts if there are any unusual patterns.
2. What data does the Com.bot Conversational Analytics Dashboard monitor?
The Com.bot Conversational Analytics Dashboard monitors details such as how accurately it identifies user intentions, how often conversations are completed, the speed of responses, and how happy users are. It also provides a breakdown of these metrics over time, allowing you to see trends and patterns in your chatbot’s performance.
3. How can I use the data from Com.bot Conversational Analytics Dashboard?
The Com.bot Conversational Analytics Dashboard provides information to assess your chatbot’s performance and identify methods to make it better. By studying the gathered information, you can make informed choices to improve your chatbot’s effectiveness and make the user experience better.
4. Could you get the data from the Com.bot Analytics Dashboard?
Yes, you can use the Com.bot Conversational Analytics Dashboard to save data as CSV or JSON files for more analysis. This feature lets you share the data with your team and connect it with other tools for a more thorough analysis.
5. How frequently is the information refreshed on the Com.bot Conversational Analytics Dashboard?
The Com.bot Conversational Analytics Dashboard updates immediately, giving you the latest and precise information about your chatbot’s performance. This lets you quickly change and improve your chatbot when necessary.
6. Does the Com.bot Conversational Analytics Dashboard notify users about unusual patterns?
The Com.bot Conversational Analytics Dashboard notifies you about strange activity in your chatbot, informing you when its performance changes suddenly. This feature keeps you informed about possible problems so you can quickly fix them.